

I recently began a move of the Gadget Wisdom and related sites to a new server. The purpose of this was laying the infrastructure for a major upgrade.
One of the major pushes was upgrading monitoring features. Some of the software being used was no longer being maintained, and replacements had to be found.
Nagios and Munin are two of the most popular tools used by IT specialists for infrastructure monitoring. There are good reasons that I opted for something more lightweight though. There are dozens of monitoring tools, and it is quite overwhelming to choose one. These are two that I have been happy with so far.
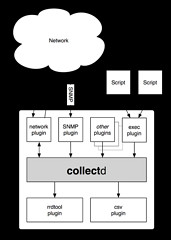
One of the first ones I installed is collectd. Collectd is a tool that stores performance data. It is plugin based, which means it can be used to pipe into a variety of different pieces of software. So, it is incredibly extensible, which leaves room for future data gathering and future output. It is also incredibly lightweight, which has its advantages.
To output the data into graphs, I’m using a simple front-end called Jarmon for now. Jarmon downloads the files generated by collectd, and renders them on the client side.
The second is a monitoring tool called monit. Monit monitors various services to ensure they are up, and can take action if they go down, such as sending an alert, restarting a service, executing a script, etc. One of the most fun things about having alerts is reading them…and in many cases, knowing I don’t have to do anything, because I told monit to do it for me.
There will be more to come on this, but what do you use in similar situations?
